MATLAB: contour477
← ChE 477: Process Optimization
close all
clear all
clc

% CONTOUR PLOTS

% Example
% Create a mesh graph of the expression
% over the domain -5 < x < 5, -2*pi < y < 2*pi:
figure
ezmesh('y/(1 + x^2 + y^2)',[-5,5,-2*pi,2*pi])

% Example
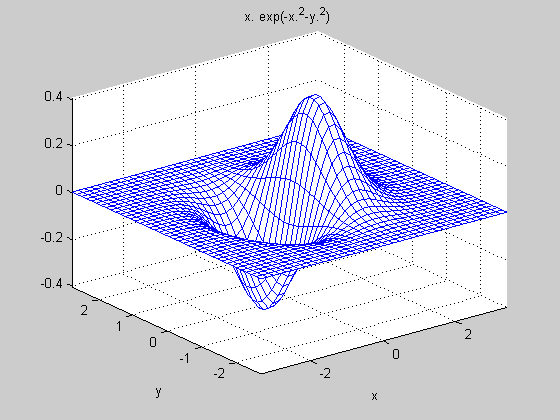
figure
f = @(x,y) x.*exp(-x.^2-y.^2);
ezmesh(f,40)
colormap([0 0 1])

% Example
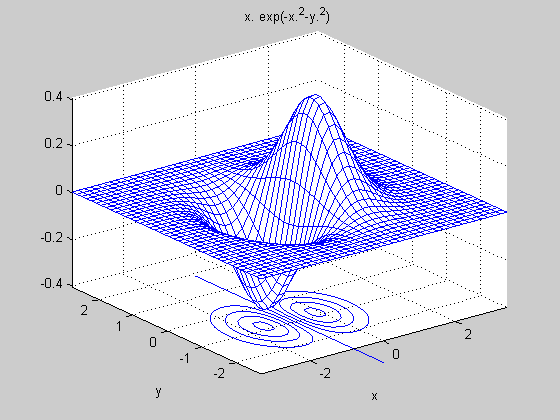
figure
f = @(x,y) x.*exp(-x.^2-y.^2);
ezmeshc(f,40)
colormap([0 0 1])

% Example
% Create a mesh graph of the expression
% over the domain -5 < x < 5, -2*pi < y < 2*pi:
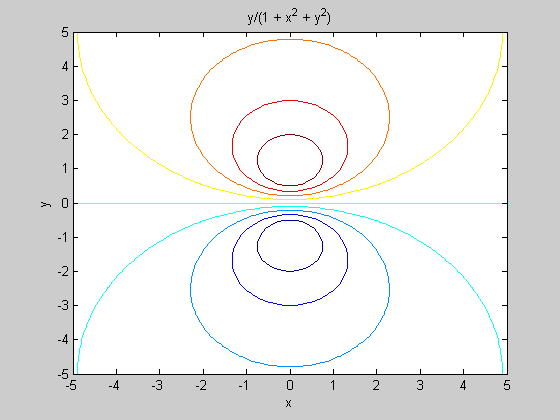
figure
ezcontour('y/(1 + x^2 + y^2)',[-5,5],100)

% Example
% Create a mesh/contour graph of the expression
% over the domain -5 < x < 5, -2*pi < y < 2*pi:
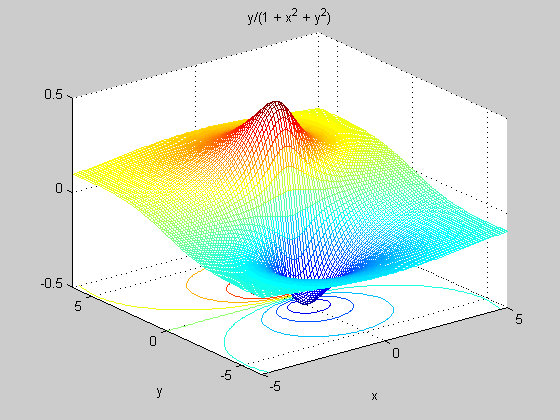
figure
ezmeshc('y/(1 + x^2 + y^2)',[-5,5,-2*pi,2*pi],100)

% Example
% Create a surface plot of the expression
% over the domain -5 < x < 5, -2*pi < y < 2*pi,
% with a computational grid of size 35-by-35:
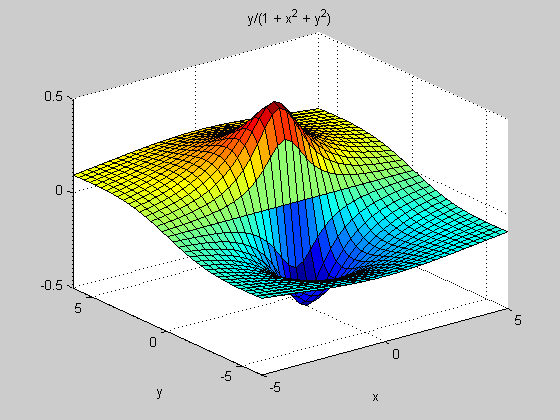
figure
ezsurf('y/(1 + x^2 + y^2)',[-5,5,-2*pi,2*pi],35)

% Example
% Create a surface/contour plot of the expression
% over the domain -5 < x < 5, -2*pi < y < 2*pi,
% with a computational grid of size 35-by-35:
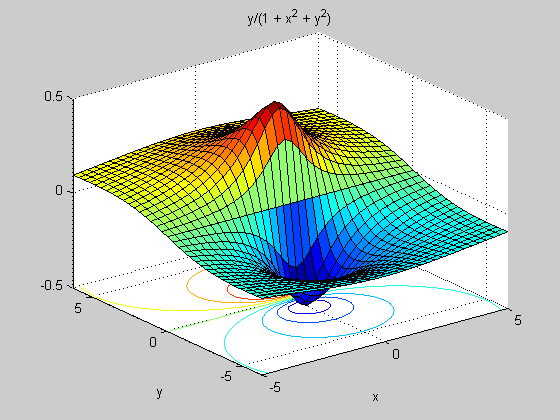
figure
ezsurfc('y/(1 + x^2 + y^2)',[-5,5,-2*pi,2*pi],35)

% Example
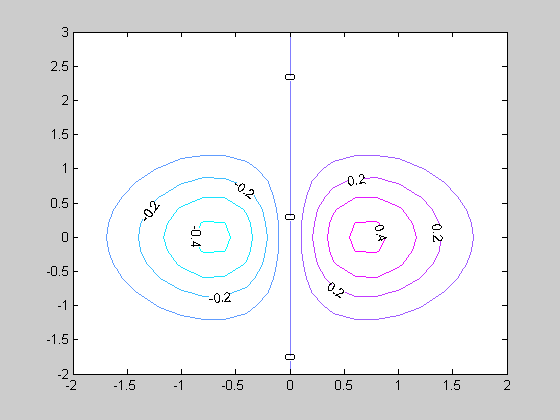
figure
[X,Y] = meshgrid(-2:.2:2,-2:.2:3);
Z = X.*exp(-X.^2-Y.^2);
[C,h] = contour(X,Y,Z);
set(h,'ShowText','on','TextStep',get(h,'LevelStep')*2);
colormap cool

% Example
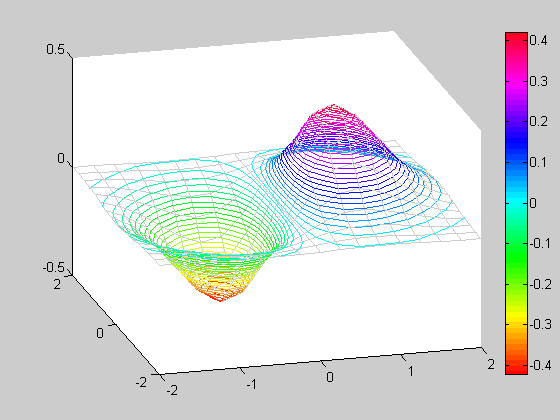
% Plot the three-dimensional contour of a function and
% superimpose a surface plot to enhance visualization of the function.
figure
[X,Y] = meshgrid([-2:.25:2]);
Z = X.*exp(-X.^2-Y.^2);
contour3(X,Y,Z,50)
surface(X,Y,Z,'EdgeColor',[.8 .8 .8],'FaceColor','none')
grid off
view(-15,25)
colormap hsv
colorbar

% Example
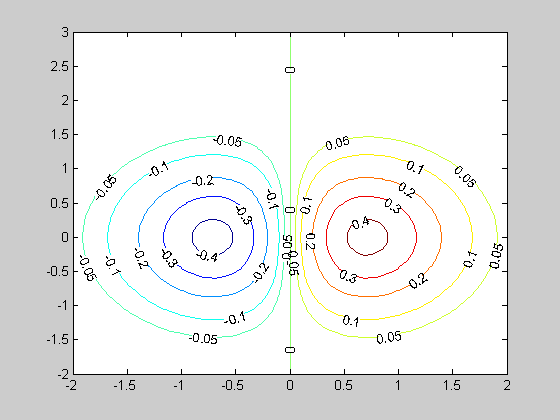
% Plot only the specified contours
figure
[X,Y] = meshgrid(-2:.05:2,-2:.05:3);
Z = X.*exp(-X.^2-Y.^2);
v=[-0.6 -0.5 -0.4 -0.3 -0.2 -0.1 -0.05 0 0.05 0.1 0.2 0.3 0.4 0.5 0.6];
[C,h] = contour(X,Y,Z,v);
set(h,'ShowText','on');

% Example
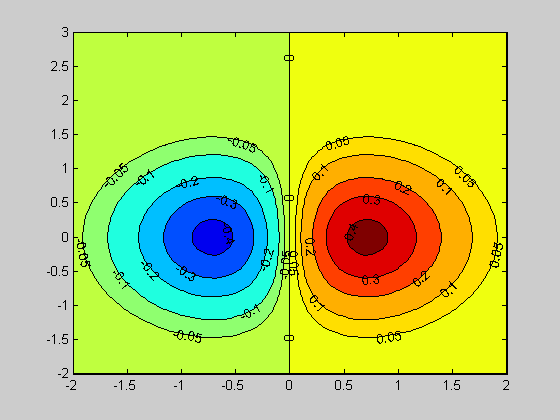
% Plot only the specified filled contours
figure
[X,Y] = meshgrid(-2:.05:2,-2:.05:3);
Z = X.*exp(-X.^2-Y.^2);
v=[-0.6 -0.5 -0.4 -0.3 -0.2 -0.1 -0.05 0 0.05 0.1 0.2 0.3 0.4 0.5 0.6];
[C,h] = contourf(X,Y,Z,v);
set(h,'ShowText','on');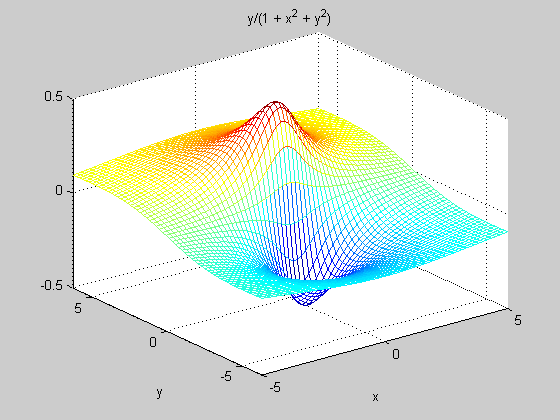
Published with MATLAB® 7.0