MATLAB: contourconstrainttableschairs
← ChE 477: Process Optimization
close all
clear all
clc

% PLOT CONTOURS & INEQUALITY & EQUALITY CONSTRAINTS
% for the Tables & Chairs Problem

% OBJ = 7 x1 + 5 x2
%   g1: 4 x1 + 3 x2 - 240 < 0
%   g2: 2 x1 +   x2 - 100 < 0
%   x1 > 0
%   x2 > 0

% Ugur Akman 2004

x1=0:0.5:100;
x2=0:0.5:100;

[X1 X2] = meshgrid(x1,x2);

f1 = 7*X1 + 5*X2;

sidec1 = X1;
sidec2 = X2;

ineq1 = 4*X1 + 3*X2 - 240;
ineq2 = 2*X1 + X2 - 100;

[C1,h1] = contour(x1,x2,ineq1,[0,0],'r-','LineWidth',4);
clabel(C1,h1);
hold on

[C2,h2] = contour(x1,x2,ineq2,[0,0],'m-','LineWidth',4);
clabel(C2,h2);

[C3,h3] = contour(x1,x2,sidec1,[0,0],'b-','LineWidth',4);
clabel(C3,h3);

[C4,h4] = contour(x1,x2,sidec2,[0,0],'k-','LineWidth',4);
clabel(C4,h4);

v = [ 50:50:300  410 500:50:1100];
% plot contour levels between 50-300 with increments of 50,
% 410 (optimal value), and 500-1100 with increments of 50
[C,h] = contour(x1,x2,f1,v,'g-','LineWidth',2);
clabel(C,h);

xlabel(' x1 values','FontName','times','FontSize',12,'FontWeight','bold');
ylabel(' x2 values','FontName','times','FontSize',12,'FontWeight','bold');

grid
hold off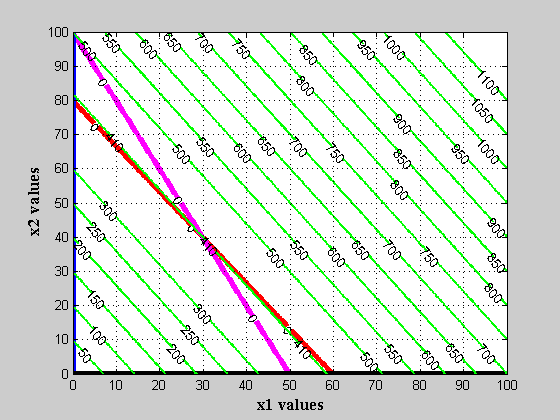
Published with MATLAB® 7.0