MATLAB: gradplot477
← ChE 477: Process Optimization
close all
clear all
clc

% GRADIENT / CONTOUR PLOTS

% Example
% Plot the gradient field of the function:
figure
[X,Y] = meshgrid(-2:.2:2);
Z = X.*exp(-X.^2 - Y.^2);
[DX,DY] = gradient(Z,.2,.2);
contour(X,Y,Z)
hold on
quiver(X,Y,DX,DY)
colormap hsv
hold off

% Example
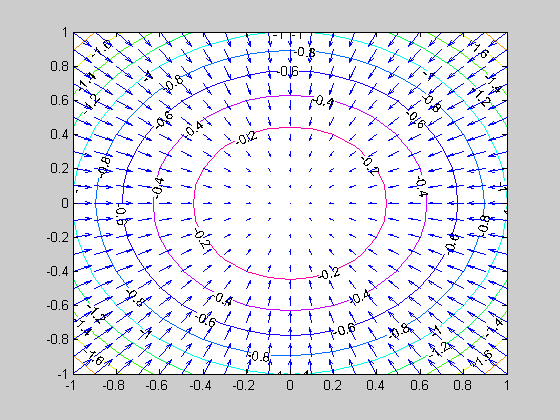
% Plot the gradient field of the function:
figure
[X,Y] = meshgrid(-1:0.1:1);
Z = -X.^2-Y.^2;
[DX,DY] = gradient(Z,.1,.1);
[C,h] = contour(X,Y,Z,11);
set(h,'ShowText','on');
hold on
quiver(X,Y,DX,DY)
colormap hsv
hold off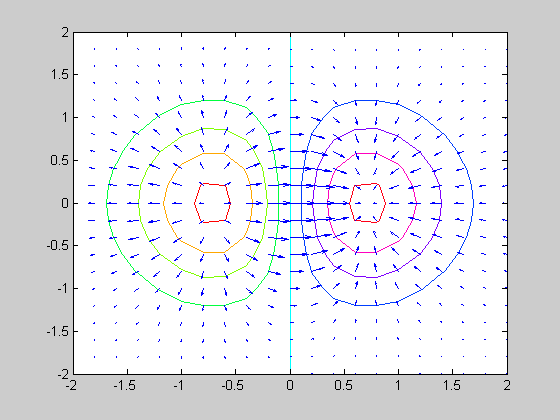
Published with MATLAB® 7.0